

GreenFeed Visits: How It Works and Why It Captures the Diurnal Methane Emission Profile.
The GreenFeed feeding schedule allows animals to visit at different times of the day, with visits distributed across the full 24-hour period over multiple days.
More than 10 years of C-Lock research validates what we recommend: reliable GreenFeed data come from enough valid visits, spread across the full day, over enough days. Here's how a GreenFeed study should run, and why.
20–30 Visits Over One to Two Weeks.
Enough to Capture the Full Daily Methane Pattern.
For most cattle studies, aim for at least 20–30 valid GreenFeed visits per animal, collected over 7–14 days or longer, with visits spread across the 24-hour cycle. Four independent studies, covering feedlot, drylot, and grazing cattle, reached the same range. In one study of nearly 500 feedlot steers, 30 visits cut variance by about 72%, with little gained after that. Past about 30–50 visits, extra visits improve precision slightly.
This is math and statistics: if you want to get closer to the true value (in this scenario, mean daily methane emissions) but want to apply a sampling strategy instead of measuring continuously for 24 hours, having multiple samples at different points in time (a random process), covering the 24-hour window over multiple days, should provide a more representative estimate of the true mean. If you have a sampling strategy with fixed sampling times, this can introduce bias, and besides that, it does not reflect the practical reality in the field.
How a GreenFeed Visit Works.
In freestall, confined and pasture conditions, GreenFeed doesn't sample on a clock. Each animal decides when to visit, and that's what spreads its measurements across the day. The bait delivery system encourages animals to visit GreenFeed and remain at the unit long enough to obtain a valid measurement.
Not Tied to Feed Delivery.
GreenFeed releases bait only after a set interval since an animal's last visit, not since TMR delivery. An animal might arrive too early and get no bait, show up right on time, find another animal at the unit, or come back hours later. Each real visit resets its clock. Over a study, visit times have a substantial random component, drifting from day to day, and measurements naturally build up across the 24-hour cycle.
Where Sampling Plans Go Wrong.
The right equipment, the wrong plan.
Three ways a GreenFeed study can miss.
Too Few Visits
A single day's visits can't represent an animal's emissions. In a 59-day beef heifer study, the 95% confidence interval for methane was ±20% with about 2 visits, tightening to ±5.3% with 36 visits over 14 days. Correlation with feed intake rose from 0.50 to 0.85 over the same span.
View the Study Here →Too Little Time
Coverage across the day builds over days, not hours. By day 7, 86% of animals had visited in at least 5 of 6 four-hour windows. By day 14, 97% had. In grazing cattle, methane measurements stabilized after 12–18 days.
Manafiazar et al. 2017 → Della Rosa et al. 2025 →Too Many Visits per Animal Within a Day
More visits per animal within a day means fewer animals measured, dominant animals crowding the unit, more bait eaten, and fewer background gas readings. A short interval doesn't guarantee frequent visits either: units allowing a visit every 2 hours still saw grazing cows average about 2.3 visits a day.
View the Study Here →Take a Look: Models vs. Real Visits.
Simulations are useful stress tests. But a model is only as good as its assumptions. Here's how a fixed simulated schedule compares to how cattle actually use GreenFeed.
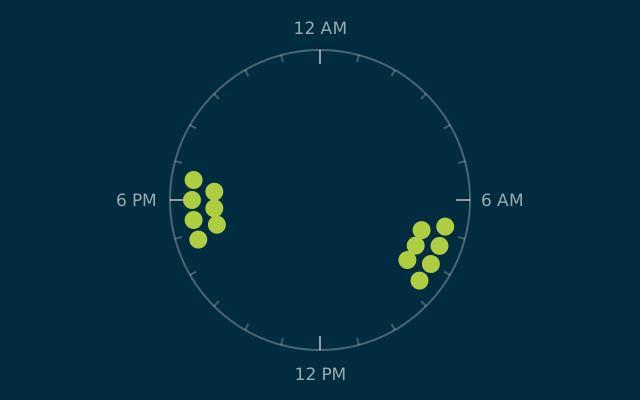
Visit timing
Locked to feeding times.
The same hours after feeding, every day.
Daily methane curve
Often restricted-feeding chamber data.
Peaks after feeding are more pronounced, with maximum-to-minimum methane emission ratios greater than 1.6.
Coverage of the day
Can miss the same hours every day.
Bias is built into the schedule.
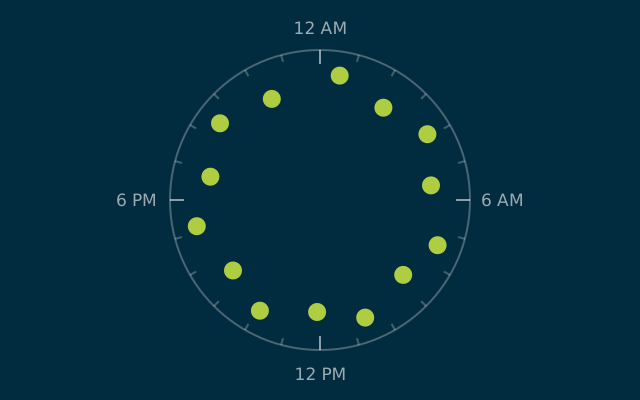
Visit timing
Drifts day to day.
Each visit resets the animal's own clock.
Measurement Frequency
Repeated sampling, long term
Many short voluntary visits build a picture across weeks or months.
Deployment
Portable & on-farm
Rolls out to commercial operations and grazing systems.
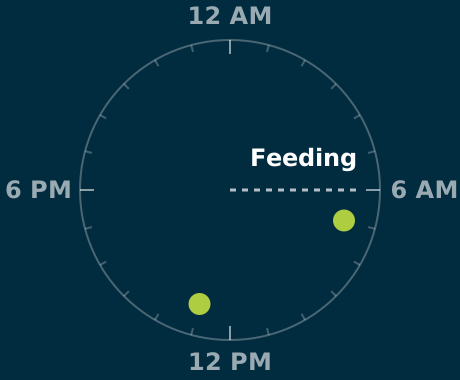
Example
How a Schedule Builds In Bias.
Picture a sampling plan where an animal is measured only 1 hour and 7 hours after morning feeding, every day. Both samples land on the same part of the methane curve, and the evening and overnight hours are never measured. Run it for a week or a month and the average will still be off, because the bias is built into the schedule.
Real GreenFeed visits don't behave this way. As part of DISS, C-Lock monitors for incorrect settings and study designs. If we saw a unit set up so animals could only visit at those times, we'd flag it and help fix the setup. The fix isn't more frequent sampling. It's making sure visits can happen across the whole day.
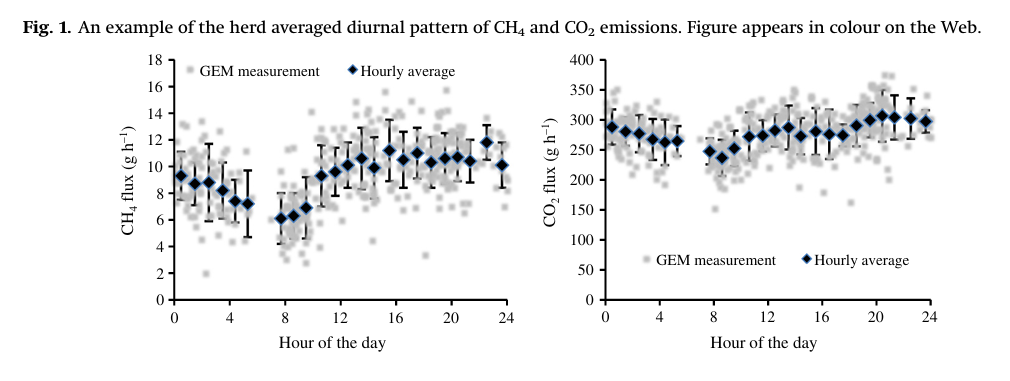
Real visits cover the whole day. Herd-averaged diurnal pattern of CH₄ and CO₂ from GreenFeed measurements, with about 2.4 visits per animal per day. Source: Manafiazar, Zimmerman & Basarab (2017), Canadian Journal of Animal Science, Fig. 1.
The best test of any sampling recommendation uses real GreenFeed visit timestamps, resampled against a continuous reference, under the conditions most users actually run.
The Turning Point
The Study That Mapped Diminishing Returns.
In a study published in 2017, researchers tracked 28 beef heifers on GreenFeed for 59 days and measured how much each additional visit actually improved the methane measurement. The answer: a lot at first, then very little.
- ~2 visits±20%
- ~36 visits±5.3%
- 50 visits±4.5%
Going from about 2 to 36 visits shrinks the error band by about three-quarters. The next 14 visits barely move it.
Going from about 2 visits to 36 cut the 95% confidence interval for methane from ±20% to ±5.3%. Adding 14 more visits only reached ±4.5%. Simple averages and time-of-day-weighted averages agreed above 0.96, because voluntary visits had already covered the day. The study was co-authored by C-Lock president Scott Zimmerman.
Setting Up for Reliable Data.
Good settings start a study right. Reviewing your data keeps it right.
Target 20–30+ Valid Visits per Animal
Four independent studies land in this range.
Measure for at Least One to Two Weeks
Plan for 7–14 days or longer, and 12–18 days for grazing cattle, so visits cover every part of the day.
Keep Animals per Unit Manageable
About 40 animals or fewer per unit keeps access even and visit numbers up.
Check Coverage Before You Analyze
Confirm most animals visited across the full day. As part of DISS, C-Lock monitors diurnal coverage and flags incorrect settings and study designs.
The Papers That Back It Up.
GreenFeed methodology is cited in 800+ peer-reviewed publications. See the full publications library.
Repeatability and Variability of Short-Term Spot Measurement of Methane and Carbon Dioxide Emissions from Beef Cattle Using GreenFeed Emissions Monitoring System
Optimizing Test Procedures for Estimating Daily Methane and Carbon Dioxide Emissions in Cattle Using Short-Term Breath Measures
Recommendations on Visit Duration and Sample Number Requirements for an Automated Head Chamber System
Effect of Number of Measurement Days on Variance in Methane and Carbon Dioxide Emissions Measured Using GreenFeed Units in Grazing Dairy Cows and Growing Heifers
Methane changes through the day.
The right sampling plan captures all of it.
Questions We Get Asked.
Most studies need at least 20–30 valid visits per animal. Four independent studies of feedlot, drylot, and grazing cattle reached this range. Beyond about 30–50 visits, precision improves slightly: in one study, the 95% confidence interval was ±5.3% at 36 visits and ±4.5% at 50.
Plan for at least 7–14 days of measurement, after a training period. In grazing dairy cows and heifers, methane measurements stabilized after 12–18 days. Animals that visit less often need longer periods to reach the same number of valid visits.
No. GreenFeed visits are voluntary and drift across the day, so a multi-day study covers the 24-hour cycle without fixed two-hour sampling. Forcing more visits per animal can reduce the number of animals measured, favor dominant animals, increase bait intake, and limit background gas readings. Even when units allowed a visit every two hours, grazing cows averaged about 2.3 visits a day.
It can, under specific conditions: restricted feeding that creates sharp methane peaks, settings or routines that keep animals from visiting at certain hours, or too few total visits. When animals can visit across the full day and each collects 20–30+ valid visits over one to two weeks or more, the bias is small. In one study, simple and time-of-day-weighted averages agreed above 0.96.
Yes. Because animals visit at different times each day, measurements accumulate across the 24-hour cycle over a study. Within 14 days, 97% of heifers in one study had visited in at least 5 of 6 four-hour windows. Where an animal's visits are uneven, time-of-day averaging corrects for it.
About 40 animals per unit is a common working maximum. Fewer animals per unit generally means more visits per animal and more even access, which shortens the time needed to collect enough valid visits.
Yes. Send us your visit data and we'll check how well each animal's visits cover the 24-hour cycle, whether visit counts and durations meet your targets, and whether your settings could be limiting visits. C-Lock already reviews diurnal coverage as part of our quality control.