

Your Pen Average Is Hiding
Your Extra Profit.
The pen average tells you what the pen cost. It can’t tell you which animals ran up the bill. Measure each animal and you stop guessing — you cull, sort, and breed on what every head actually produced.
Same Pen.
Same Ration. Who’s Your Best Earner?
Two bulls in the same pen, on the same ration, gaining within a quarter-pound a day of each other. One put on weight for 74¢ a pound. The other cost 99¢. Over the rail you could not pick the winner.
The Number That Actually Matters.
Cost of gain is the only number that tells you whether an animal made you money. It takes three inputs and every one of them has to be measured on the animal, not on the pen.
Run that on the pen and you get one number for a hundred head. Run it on the animal and you get a hundred numbers — and a ranking you can actually do something with.
Where the Money Hides.
Three places the pen average covers up a cost you’re already paying.
Same Weight. Same Gain. Different Feed Bill.
Two animals can weigh the same and gain the same on meaningfully different feed. Across 1,244 head, the most efficient ate 12% less dry matter at equal weight, gain, and fatness. The pen average splits that bill evenly.
View the Study Here →The Animal That Quits Gaining in Week Six
A start weight and a closeout weight tell you what happened over 150 days — not when. An animal that stalls three weeks and compensates later closes out on target and looks identical on paper. You fed the stall.
The Animal That’s Getting Sick
Cattle go off feed 6.8 days before crews spot illness, with intake down 39% by then. At the pen level that animal disappears into the average. At the animal level, it’s a flag.
View the Study Here →Two Animals. Same Pen.
Different Engines.
Same ration, same test pen, nearly identical gain on the scale. Bull 627 isn’t the worst animal in the group — he’s an ordinary-looking bull in the middle of it. He still costs a third more per pound, and the pen average will never tell you.
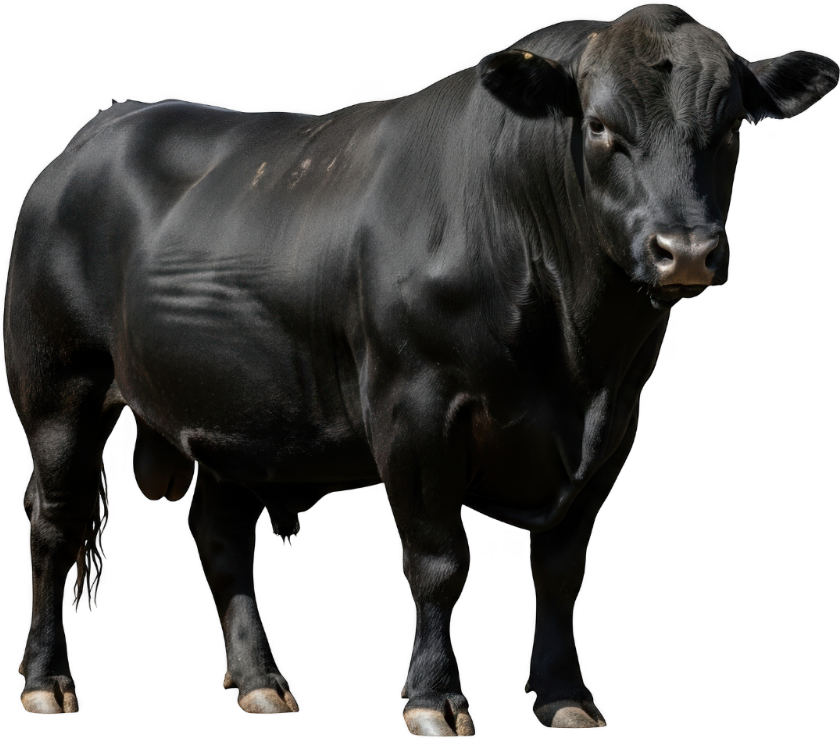
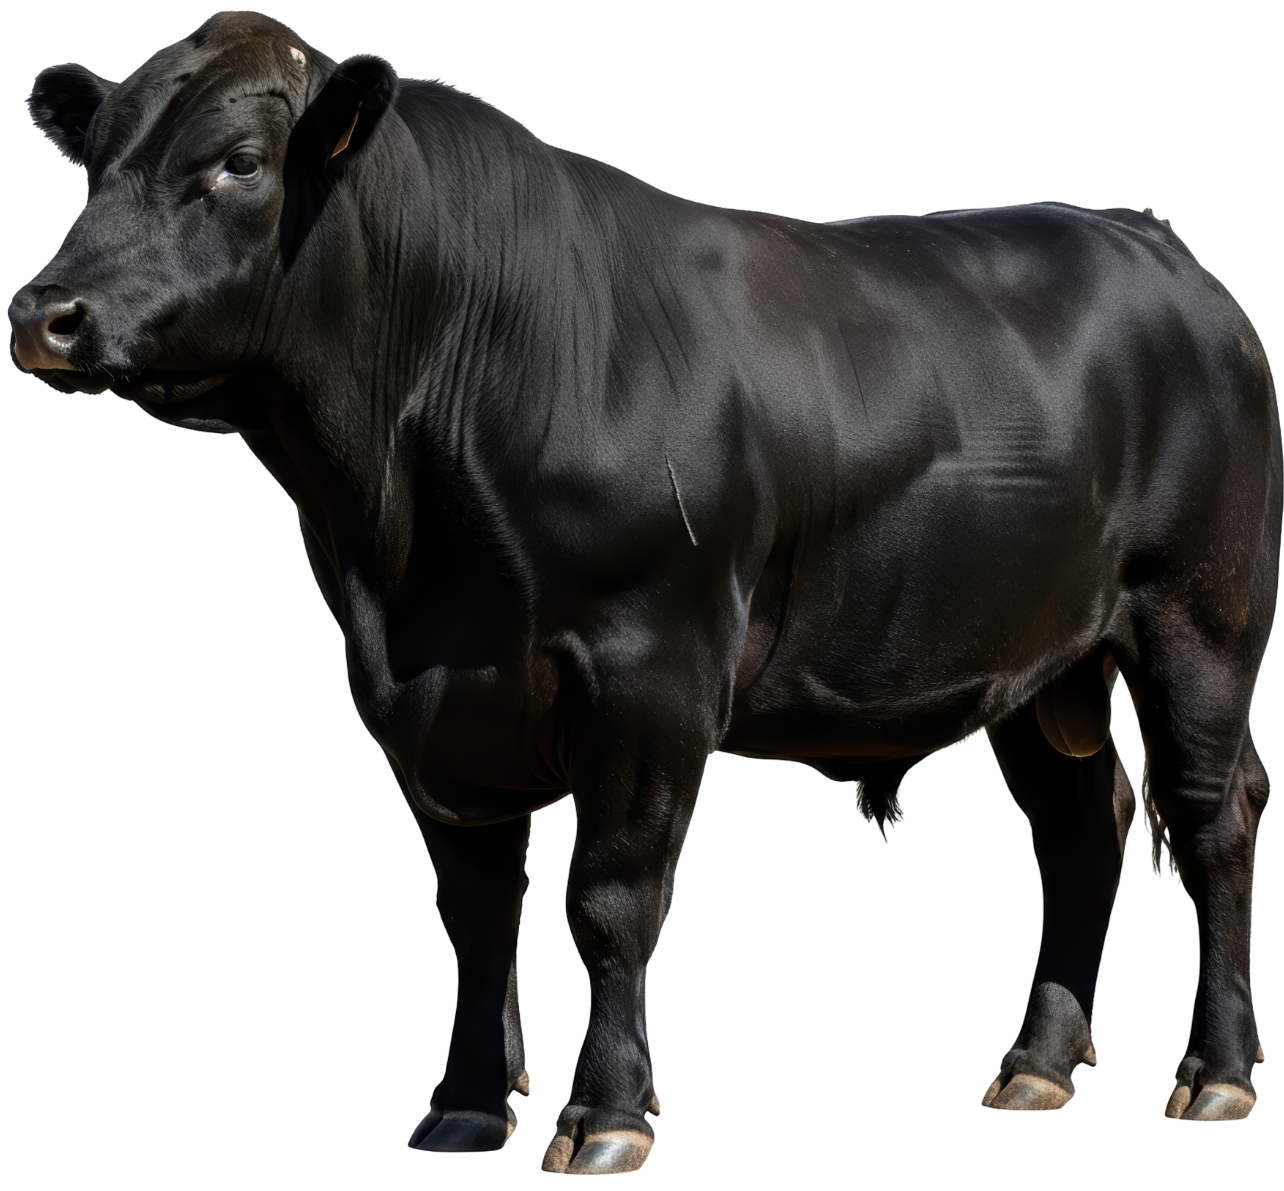
Cost of gain calculated at a ration price of $225/ton dry matter. Cost of gain = (daily intake ÷ daily gain) × ration cost per pound. Per-head swing assumes 3.0 lb average daily gain across a 180-day test.
Source · C-Lock Cost of Gain Index (CGI), contemporary group n=180
The Same Problem Affects Dairy.
The same blind spot runs through the parlor. Two cows eat the same ration and milk in the same string — the bulk tank averages them together.
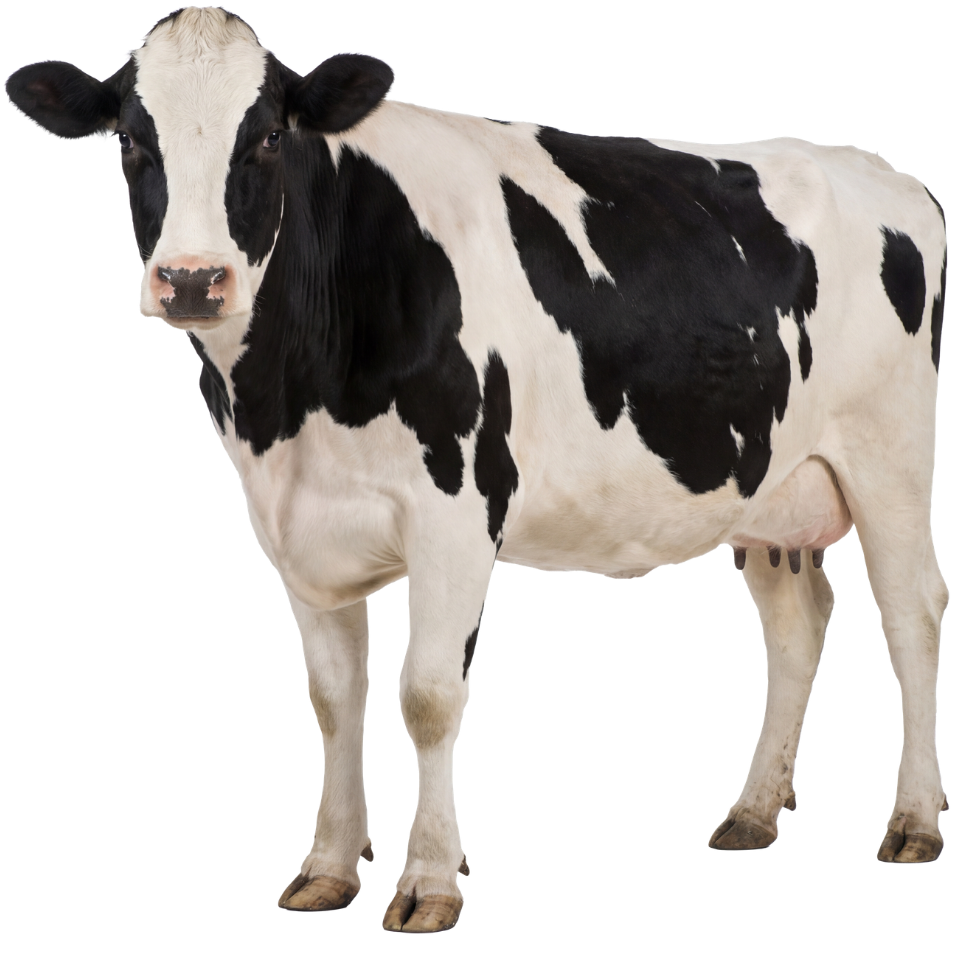
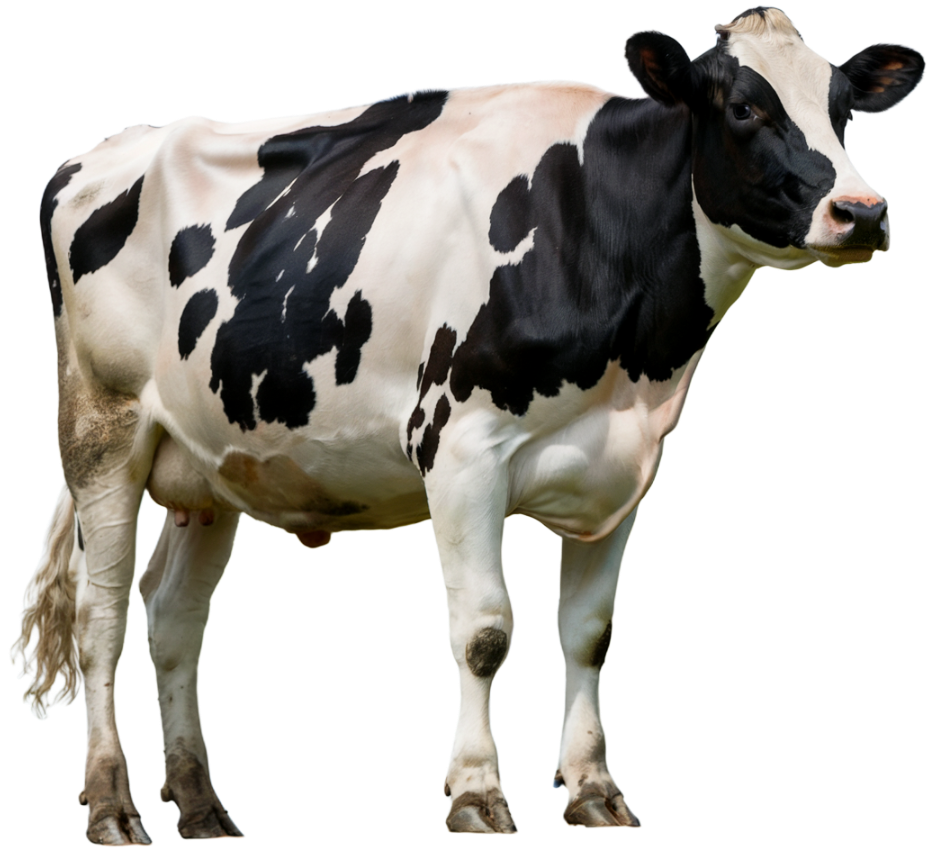
Source · C-Lock Metabolic Efficiency Index (MEI), Dairy Experts cohort n=74
Sort By The Decile
Your Herd, Ranked Top to Bottom.
Score every animal in the contemporary group and the spread is a clean staircase — the same shape every cycle. The average sits in the middle and describes none of them.
D1 · Your best engines
Converting feed to gain at $0.74 a pound. These are the genetics to keep and breed forward.
D10 · Costing you the most
Needing $1.45 for the same pound of gain — nearly double, on the same feed.
Every step down costs you more per pound. D1 converts at $0.74. D10 needs $1.45 for the same pound of gain — nearly double, on the same feed, in the same pen, under the same management.
That difference is heritable. It rides into the calves. Rank, retain, and cull on it for a few cycles and the bottom of your herd starts to look like the top did when you began — the same reason where a measurement is taken changes what it can tell you.
Every Animal in One View.
The SmartLine Dashboard gives you one row for every animal in your herd — individual daily intake, daily gain, feed conversion, and cost of gain, ranked against your pen average and updated in real time. Log in any time to see where your herd stands.
Sort by cost of gain and the ranking writes itself. P532 converted at $0.39 a pound; P533 needed $0.85 — against a pen average of $0.62 that described neither of them. Note the 12-day window: over short intervals, gut fill swings daily gain hard in both directions. That is precisely why continuous daily measurement beats a start weight and a closeout weight.
SmartLine Dashboard, 12-day measurement window, ration priced at $240/ton dry matter. Separate group from the Cost of Gain Index figures shown above.
What Each Piece Measures.
Three instruments. Each one fills in a piece of the cost-of-gain equation the pen average leaves blank.
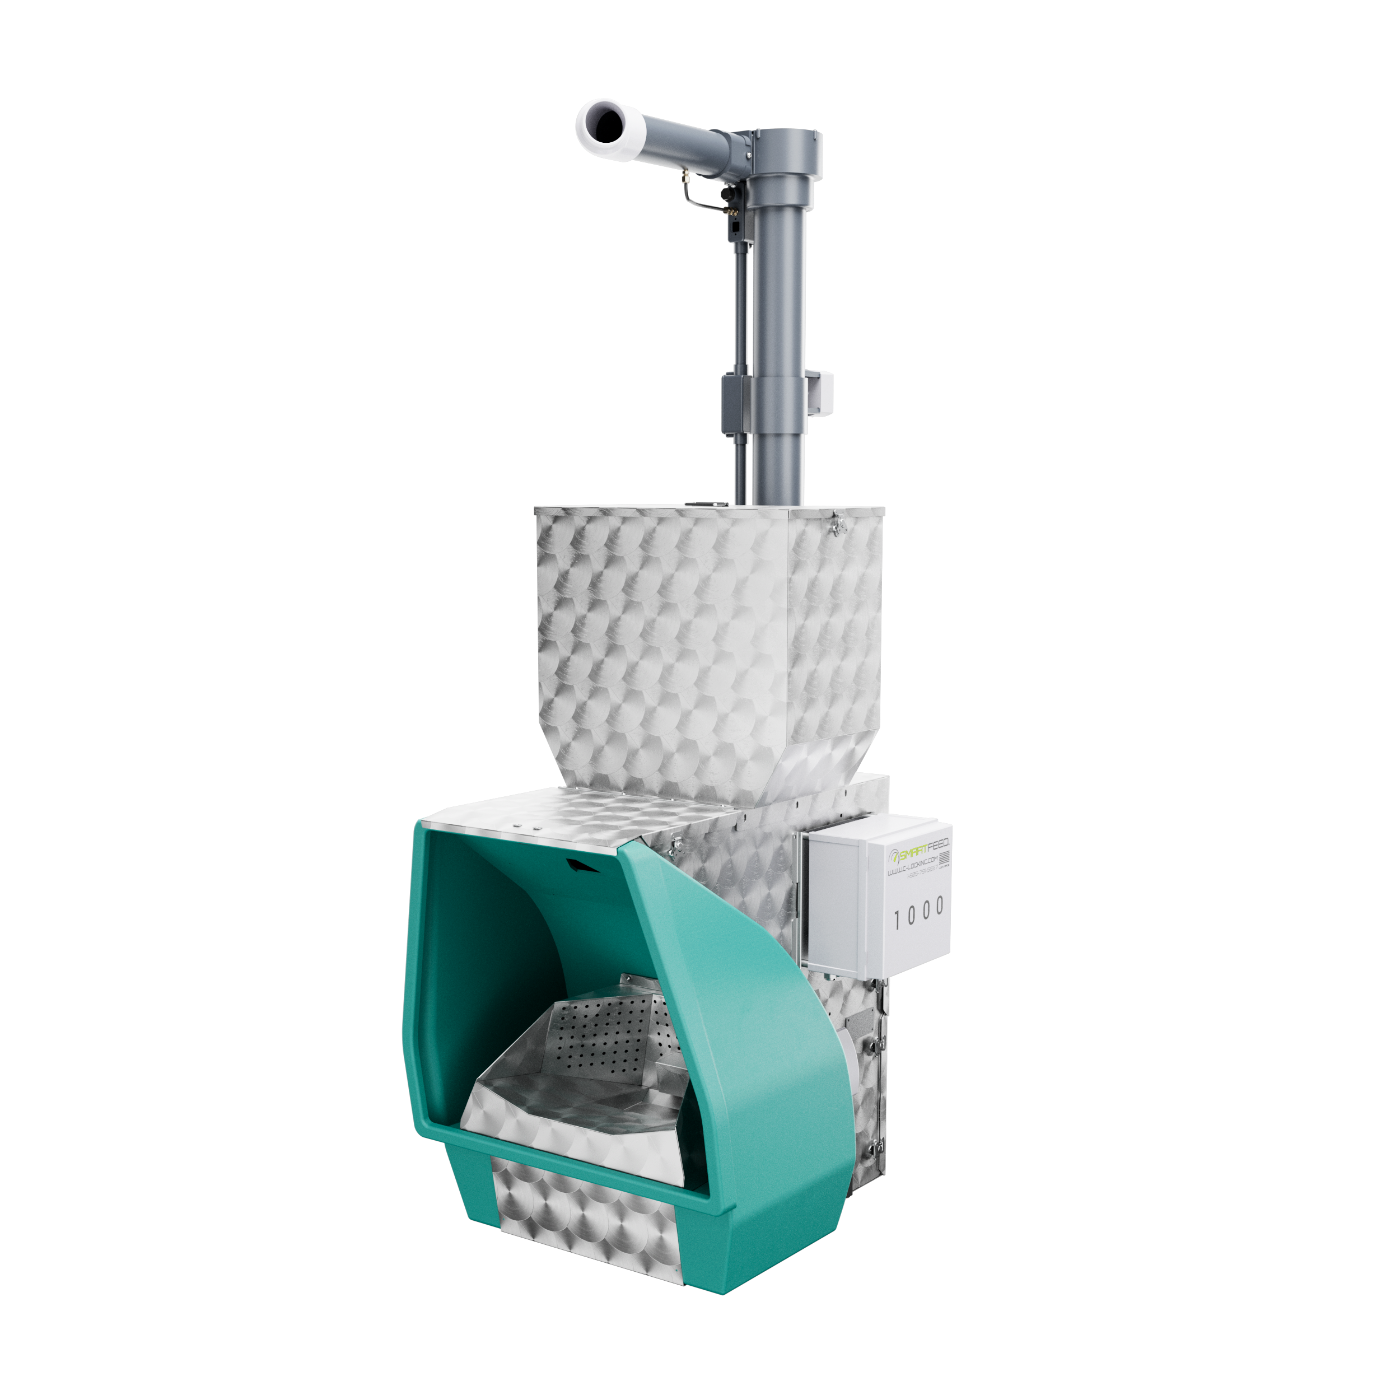
GreenFeed measures the animal’s breath to show how efficiently it is turning feed into energy and gain. Out on grass where there is no bunk, this is what ranks cattle for intake.
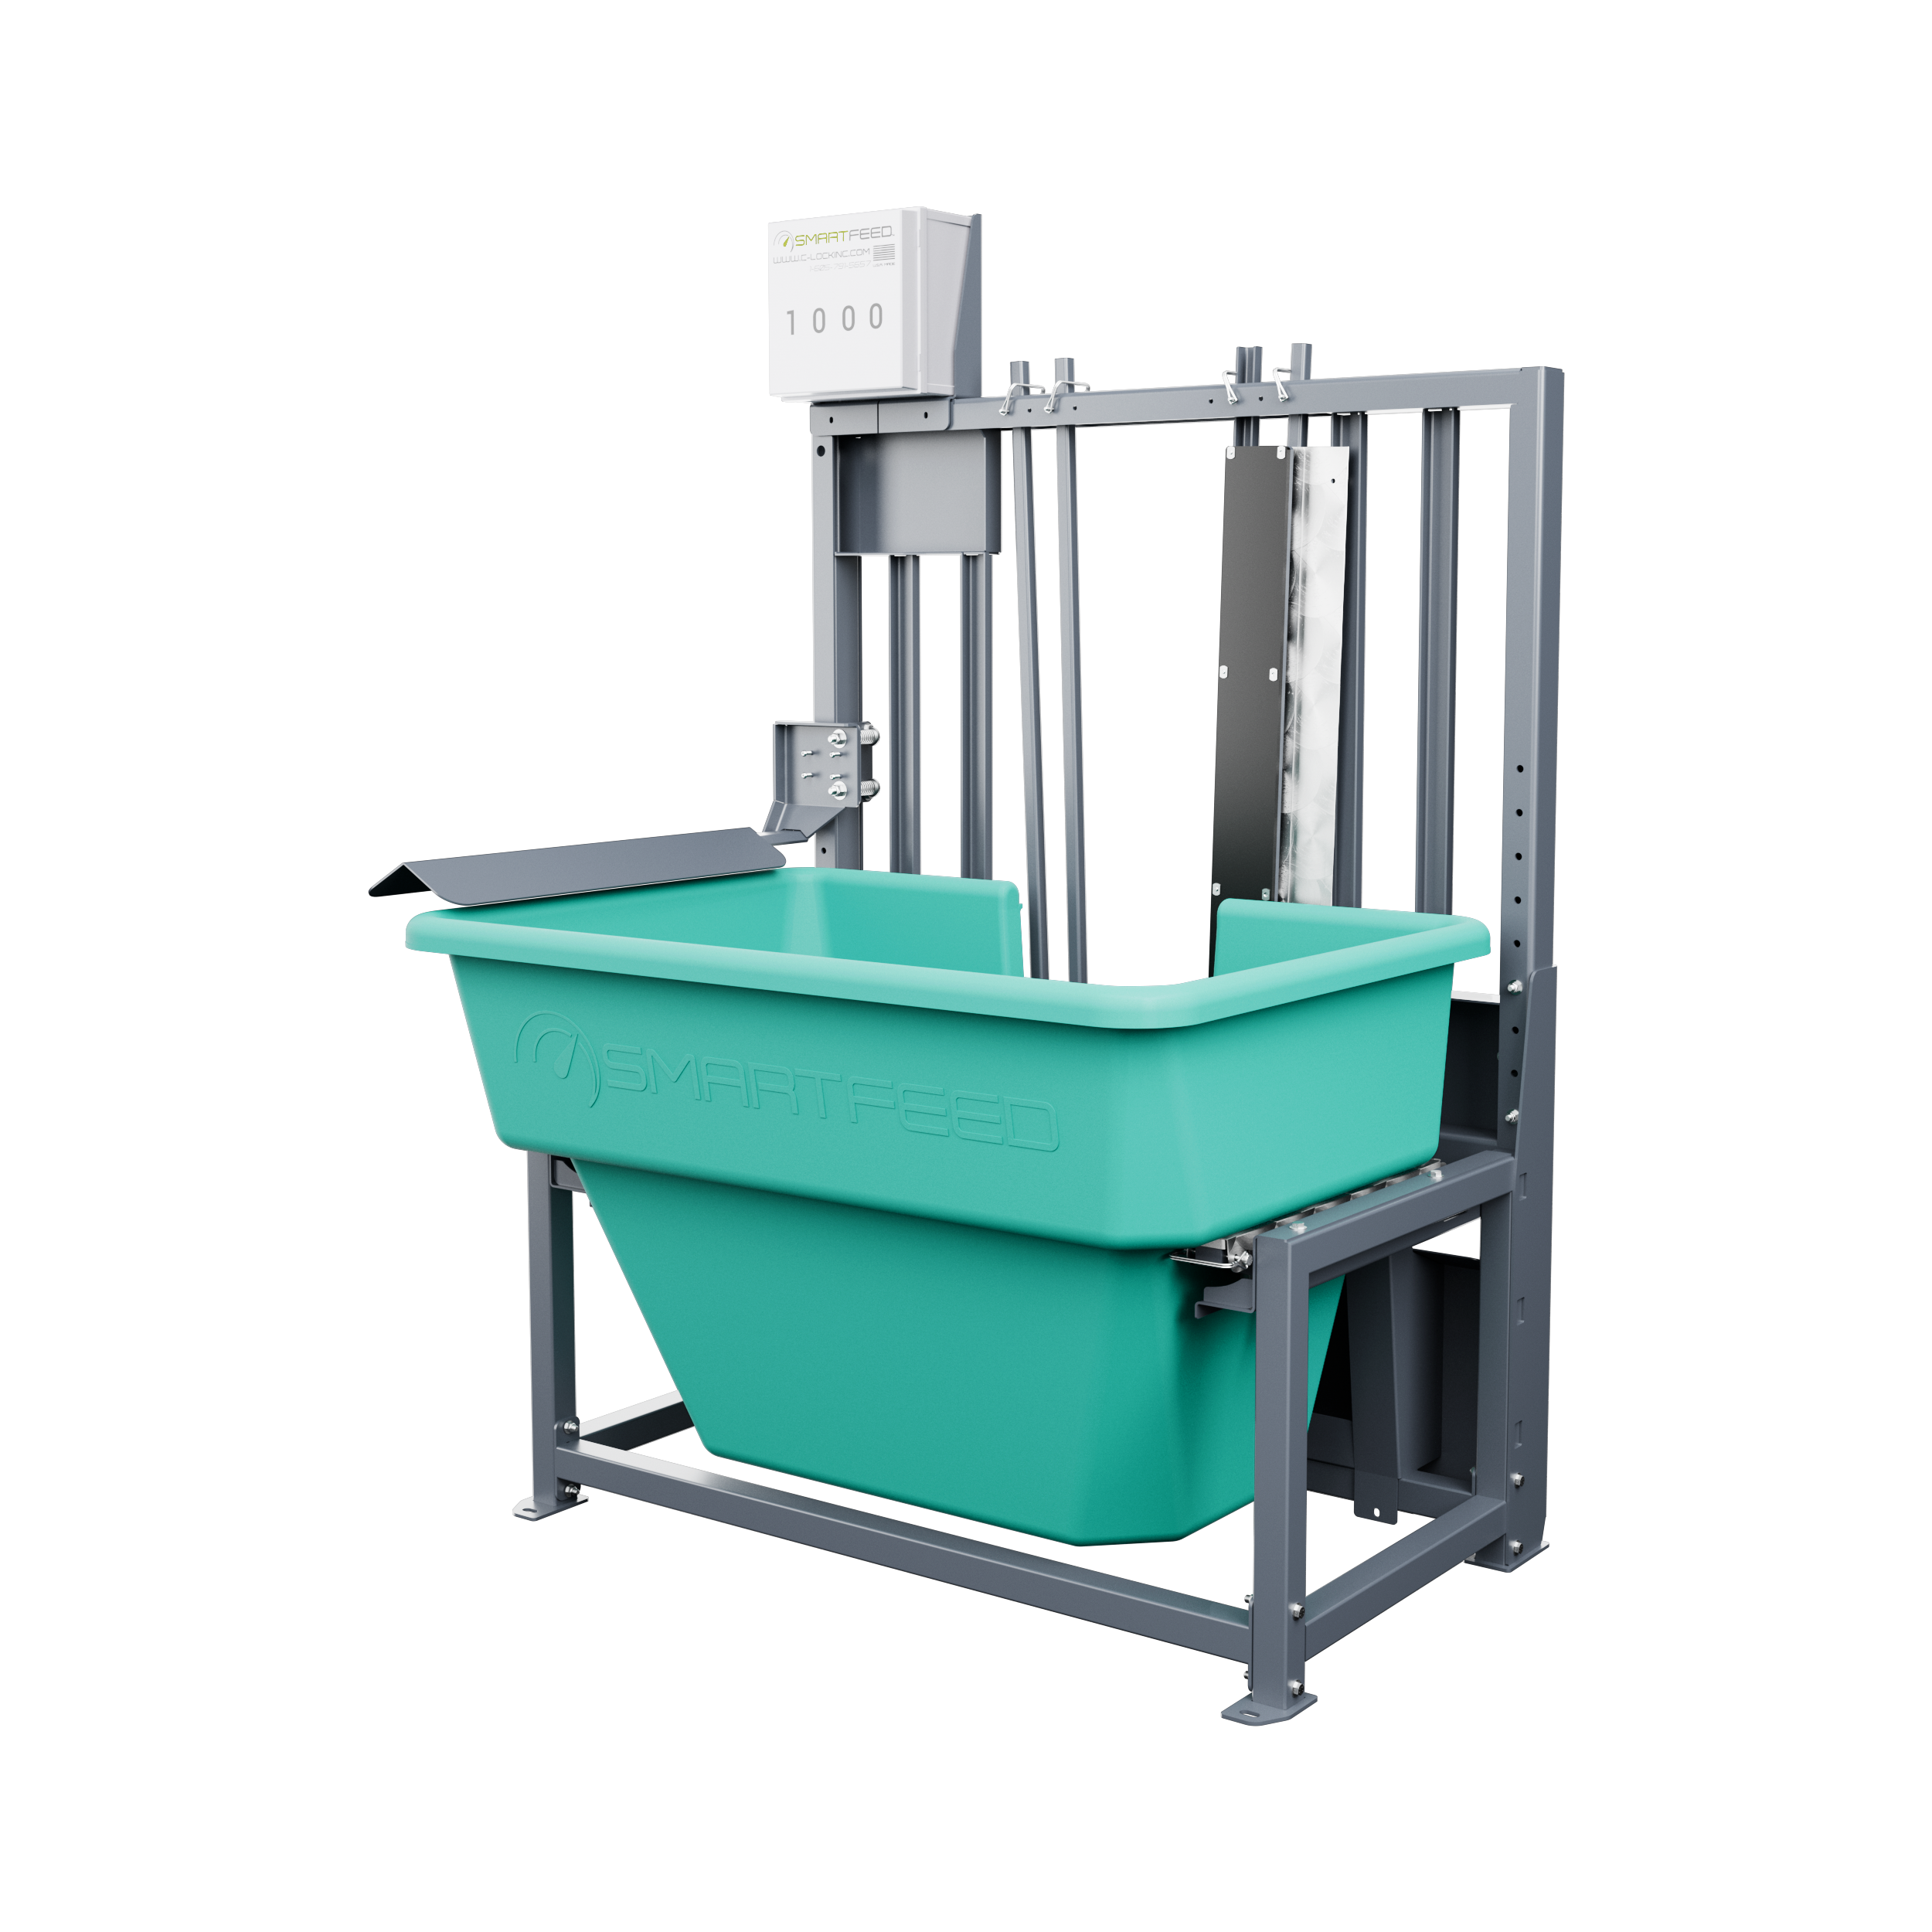
SmartFeed weighs every visit and ties it to the cow's RFID — individual intake, logged to the animal, not the herd. The cost side of the efficiency equation.
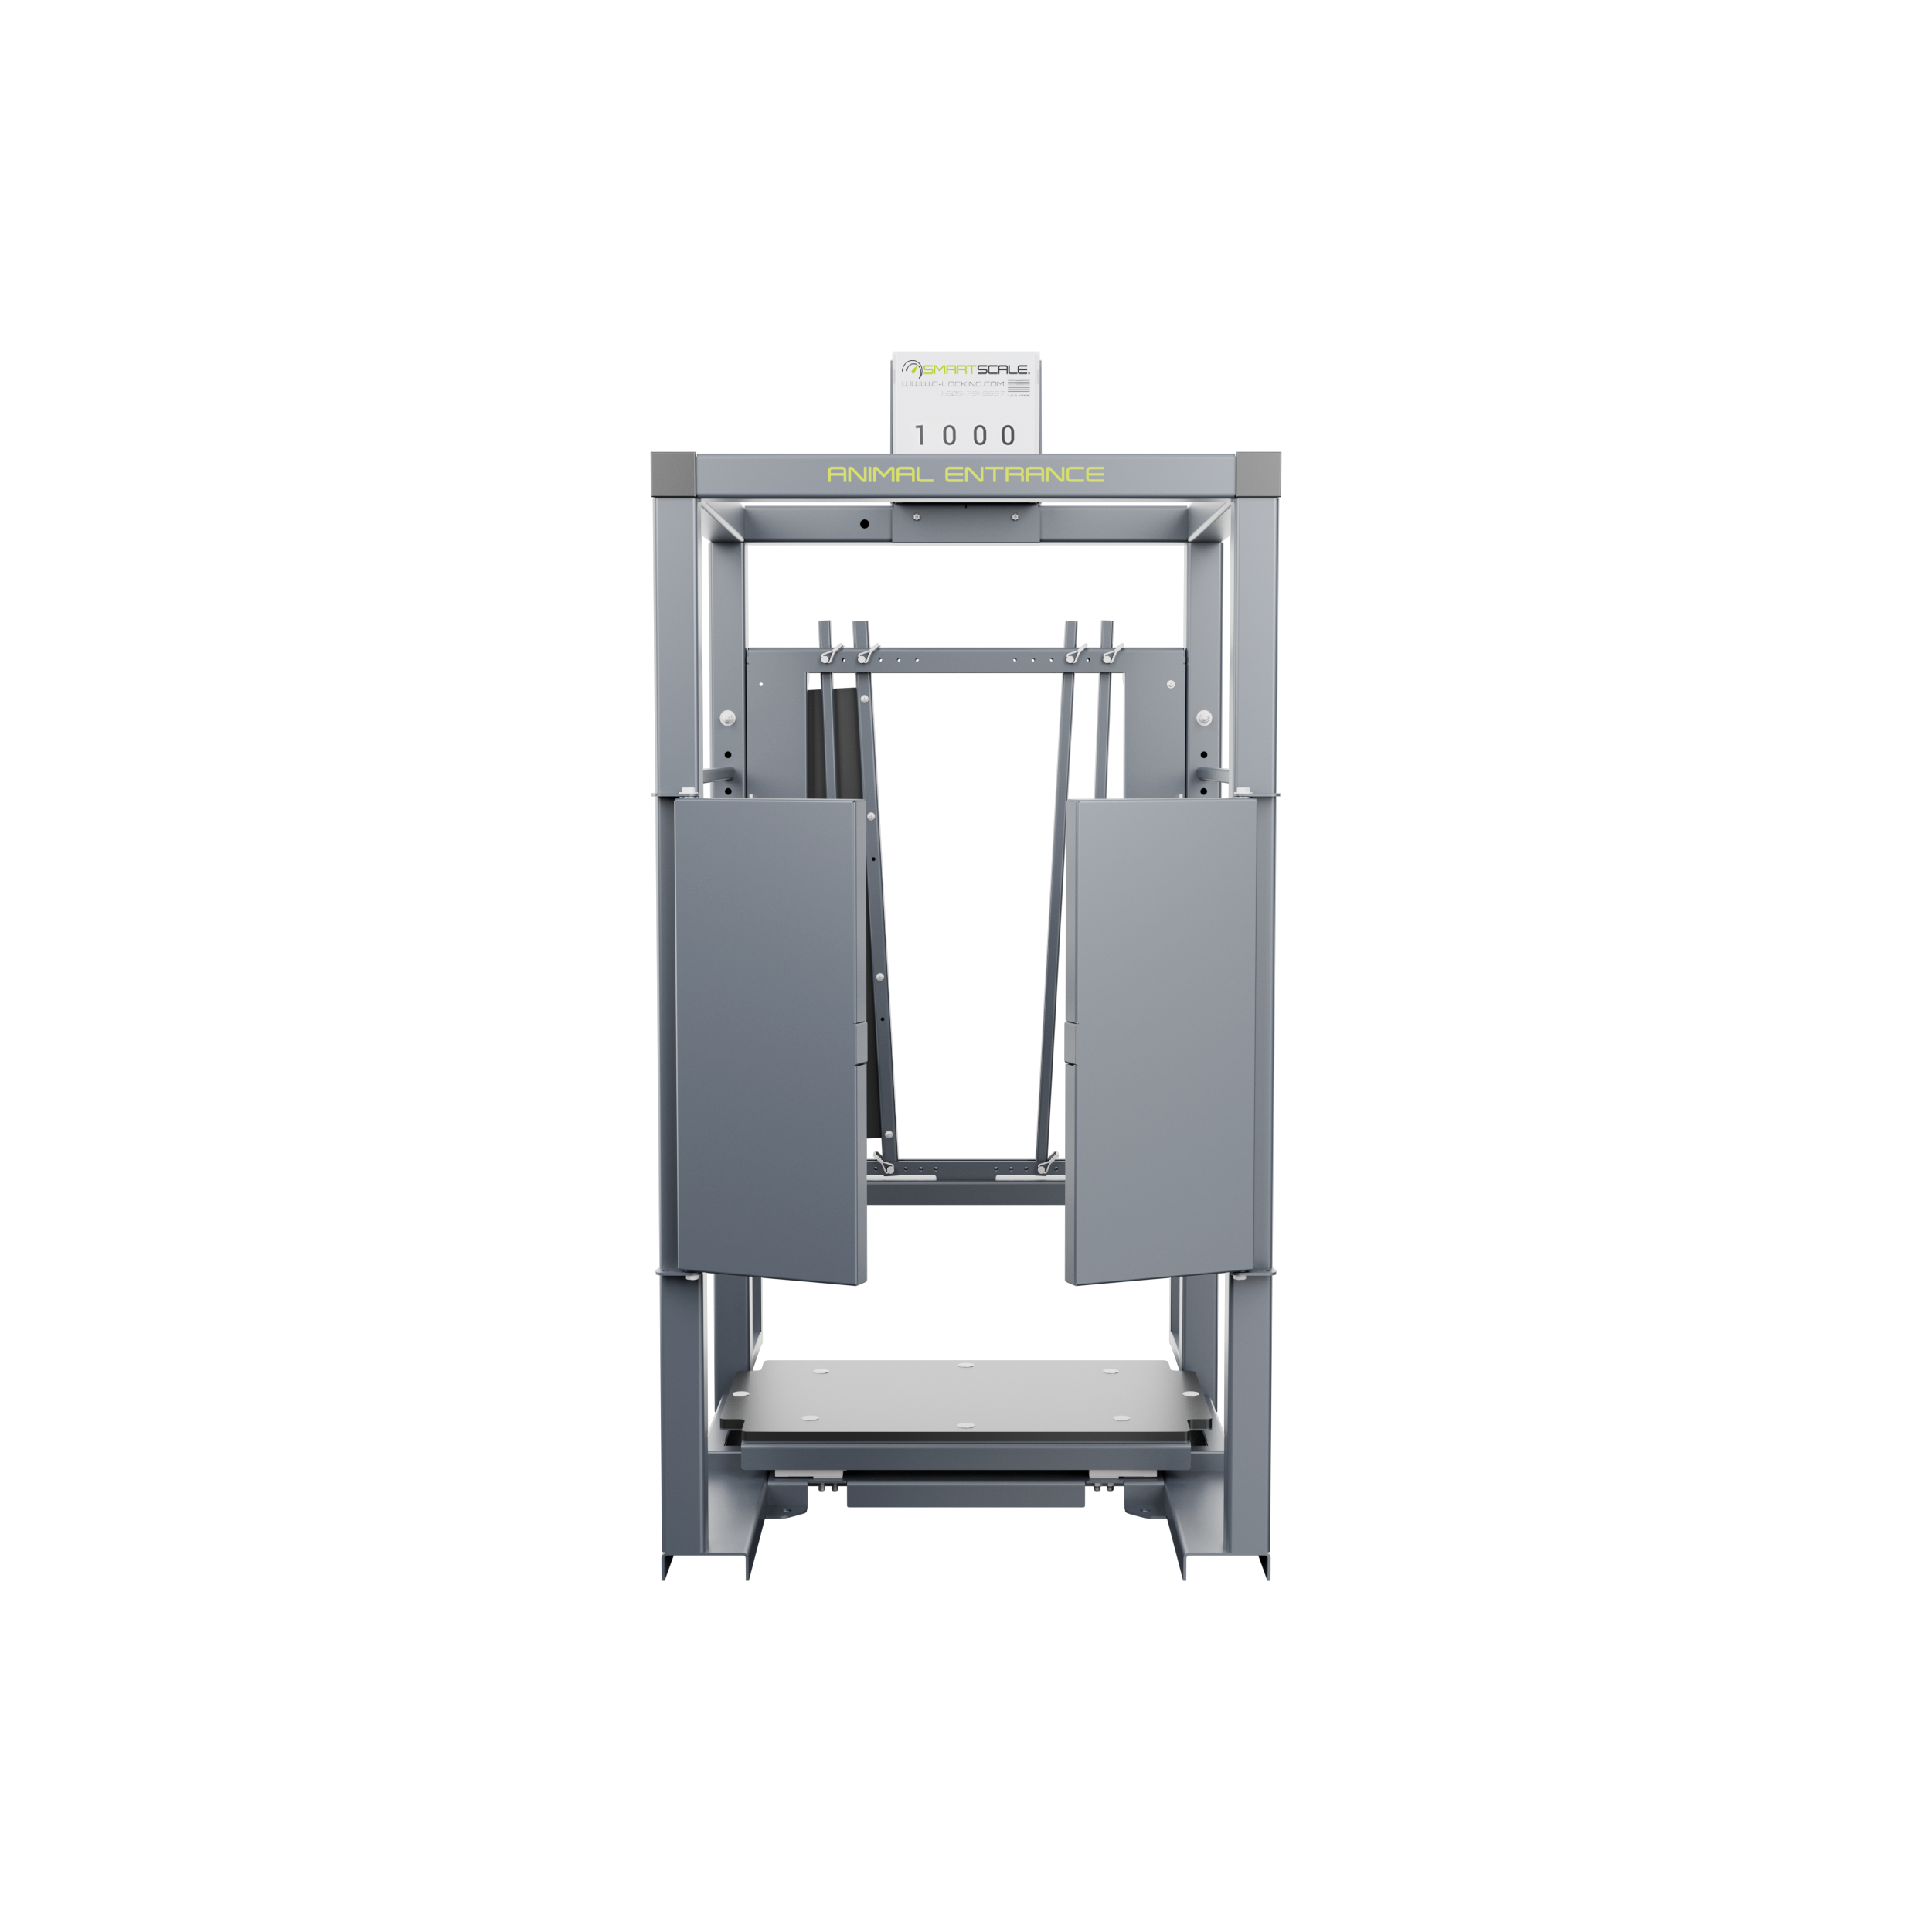
SmartScale logs body weight automatically as cattle pass through — no chute, no scheduled weigh day. Daily gain, captured hands-off. The gain side of the equation.
Want to know what these numbers would look like in your own pen? Talk to us and we’ll walk you through it.
Who This Pays Off For.
Beef or dairy, the data is the same — the decision it unlocks is different.
Beef Operations
Seedstock
Sell bulls on proof, not pedigree alone.
Cow-Calf
Keep the replacements that pay you back.
Feedlot
Sort and market on the animal, not the pen.
Dairy Operations
Dairy Herds
Cull on income over feed, not the bulk tank.
Dairy Genetics
Put sexed semen where it pays.
Dairy Replacements
Raise heifers out of proven converters.
Grazing without a bunk? GreenFeed uses carbon dioxide output plus daily gain to rank cattle on grass, where weighing feed was never an option. Learn More Here
Questions We Get Asked.
Pen intake tells you what the pen cost. It cannot tell you which animals ran up the cost, because dividing total feed by head count throws that information away permanently. Individual intake lets you calculate cost of gain per animal and rank the pen, which is what culling, sorting, and sire selection actually require.
A SmartFeed unit at the bunk records what each animal eats, and a SmartScale at the water source weighs it as it drinks — both tied to the animal’s tag, with no extra handling and no change to your ration. Weigh that against a $0.51-per-pound spread between your top and bottom quartile, roughly $275 a head over a 180-day test. Contact us and we will size a setup to your pen count and group size.
More than an average suggests. In one 180-head contemporary group on the same ration, the most efficient decile converted feed to gain at $0.74 a pound and the least efficient at $1.45 — nearly double. Top quartile versus bottom quartile came to about $275 a head across a 180-day test at 3.0 lb of gain a day.What is cost of gain?
Cost of gain is the total cost of the feed required to add one pound of body weight to an animal, expressed in dollars per pound of gain. Calculated on a pen, it produces one number. Calculated on individual animals, it produces a ranking.
No. Intake alone gives you a cost with no return attached, and gain alone gives you a return with no cost attached — neither is a verdict on the animal. Bulls 430 and 627 gained within a quarter-pound a day of each other, so gain said they were equivalent; only pairing what each one ate with what it put on showed that 627 cost a third more per pound. Cost of gain needs both halves measured on the same animal.
Rarely. Bulls 430 and 627 stood in the same pen and gained within a quarter-pound a day of each other — yet one cost a third more per pound. Over the rail you could not pick the winner. Only the number on each animal separated them.
Yes. Carbon dioxide output tracks feed intake closely, because the energy an animal gets from feed is released as CO₂ — so measuring CO₂ at the animal is a direct read on how much it is consuming. GreenFeed captures that on every visit, which lets you rank grazing cattle for intake and efficiency out on pasture where a bunk was never an option. Pair it with daily weights and you get cost of gain on animals you could not measure any other way.